Introduction and context
This is the first LUMA Lab publication. Before going into the Wi-Fi HaLow test, we wanted to provide the minimum context needed to understand why we reached this technology.
LUMA is a project we have been developing since 2024. We are Mateo Archimaut and Sebastian Perez, two cousins from Uruguay's interior who have worked together for years on different initiatives. That experience converged into a project for automating tasks that still depend on manual observation and field visits.
The first problem we chose was pest monitoring. The initial idea used a Jackson trap for fruit fly as a reference. Later we worked on a delta-trap format. In both cases, traps are distributed across the field and then checked manually. The process works, but its limit is the delay between what happens in the field and when that information is known.
Our goal was not to replace the agronomist's judgment, but to provide more frequent and organized information. An image does not decide what to do about a pest, but it can reduce the time needed to detect it. The system therefore needed to capture images, send them to a server and analyze them with computer vision.
We also surveyed 45 people linked to production and decision-making. Thirty-three owned farms and 38 already performed pest monitoring. Thirty-two did not know automatic monitoring devices, and only one said they used one. At the end, 32 asked to receive information once a validated version existed. These responses do not prove purchase intent, but they show that a relevant part of the sample understood the problem and the value of timely data.
The project also received USD 5,000 and mentoring through VIN. That support financed part of the development and allowed us to move from separate working components toward a prototype that could leave the workshop.
Field testing changed the nature of the questions. It was no longer enough to verify that the camera could take an image or that a module could transmit data. The system had to work for hours, manage energy and maintain communication at a distance. The test did not invalidate previous work, but it revealed two concrete limits: energy consumption and connectivity.
Two prototypes, two problems
Both prototypes used an ESP32, a camera, a 4G modem, a battery, a solar panel and voltage regulation. The first helped us test assembly, image capture, transmission, consumption and outdoor operation nearby. The second incorporated circuit changes and kept the shape and dimensions of a conventional delta trap, following a recommendation from INIA. Trap geometry affects airflow and lure dispersion, so we did not want to modify it without evidence.
One problem was energy consumption. The Mini-360 module based on the MP2307DN consumed between 15 and more than 40 mA at idle, depending on input and output voltages. With a 12 V input, the module consumed close to 0.9 W without doing useful work. The 4G modem also could not be fully powered off. Even with ESP32 low-power modes, the battery discharged in a few days and the solar panel could not recover it.
The second problem was connectivity. We tested the device in an apple farm in San Jose using Antel and Movistar. The connection appeared sporadically, but the signal was too weak to send images reliably. General coverage maps did not represent what happened at the exact installation point.
LoRaWAN did not solve the use case either. Its low consumption and range are useful for telemetry, counts or short messages, but we needed to send images of hundreds of kilobytes. Fragmenting them would imply too much airtime, more retries and an impractical transfer.
That left us with two limits to solve: reducing total consumption and finding a network that could carry images in the field without depending on cellular coverage.
Why we tested Wi-Fi HaLow
The new network had to meet specific requirements. It needed to connect several solar-powered devices, cross vegetation, cover hundreds of meters and carry images of approximately 200 to 600 KB. Latency was not the main priority. For the initial use case, receiving one image per day was enough, although we wanted to keep the option of increasing that frequency.
After ruling out cellular coverage as the base of the system, we looked through documentation, forums and conversations with people working on long-range networks. HaLow started to make sense because it combined range, data capacity and IP-network compatibility.
Wi-Fi HaLow is the commercial name for IEEE 802.11ah. It operates below 1 GHz and can build a Wi-Fi network between an access point and several devices. That frequency was an important part of our hypothesis: we expected better behavior through vegetation and obstacles than with conventional Wi-Fi, while still being able to carry heavier files.
For our architecture, a gateway connected to the internet through Ethernet could work as a HaLow access point, and the traps could connect to it from the field. That way, nodes would not depend on cellular coverage or another public network. It would be enough to have internet at one point of the property, even through satellite, and extend it into the field through HaLow.
We also considered Semtech's LR2021 and FLRC. In principle, it could send an image through short bursts with lower consumption than HaLow. But FLRC is a modulation, not a complete IP network. We would need to develop or integrate an additional layer to coordinate nodes and guarantee image delivery. HaLow was already available in commercial evaluation hardware, including Heltec devices. We did not conclude it was superior; we chose the option that let us measure a complete network sooner.
Before buying the hardware, we opened four Reddit discussions about image transfer, energy per transfer, vegetation, node coordination and the comparison between HaLow and FLRC. Together, those threads registered 33,200 views, 44 points and 38 comments.
| Post | Community | Views | Points | Comments | Link |
|---|---|---|---|---|---|
| LoRa FLRC vs HaLow | r/LoRa | 5,300 | 14 | 2 | View post |
| LoRa FLRC vs HaLow | r/homelab | 3,900 | 1 | 3 | View post |
| LR2021 FLRC 200-600 KB | r/LoRa | 11,000 | 23 | 8 | View post |
| IoT trap + HaLow | r/homelab | 13,000 | 6 | 25 | View post |
| Total | - | 33,200 | 44 | 38 | - |
Table 1. Recorded reach from the four connectivity posts.
The responses did not prove that one technology was adequate. They helped us define what to measure: not only link speed, but the energy and reliability needed to deliver a complete image through vegetation and possible retries.
The decision was therefore limited. We bought HaLow hardware to measure range, stability and data transfer in real conditions before designing a custom PCB.
What we bought and what it cost
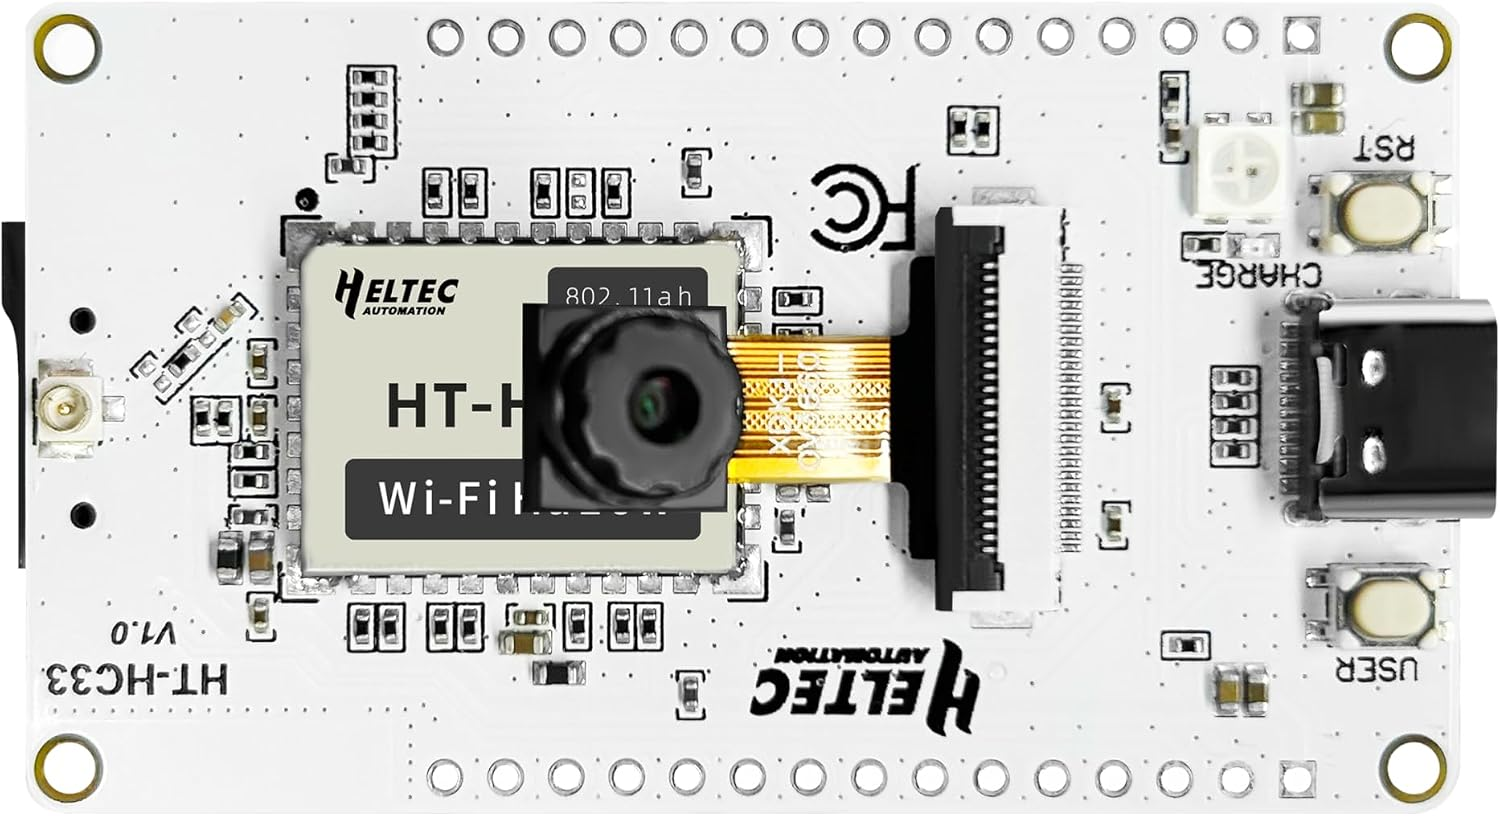
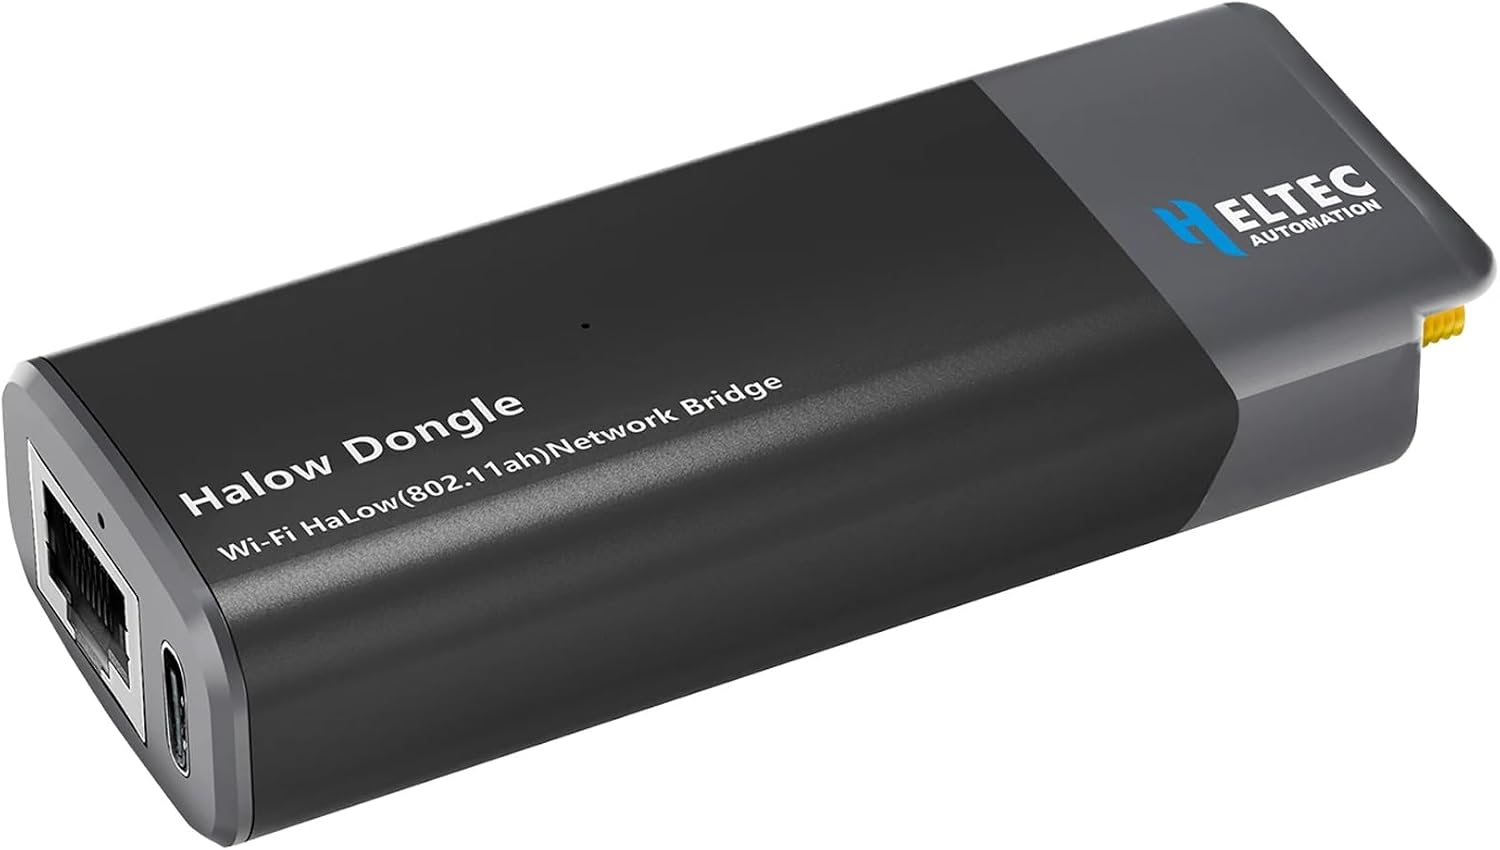
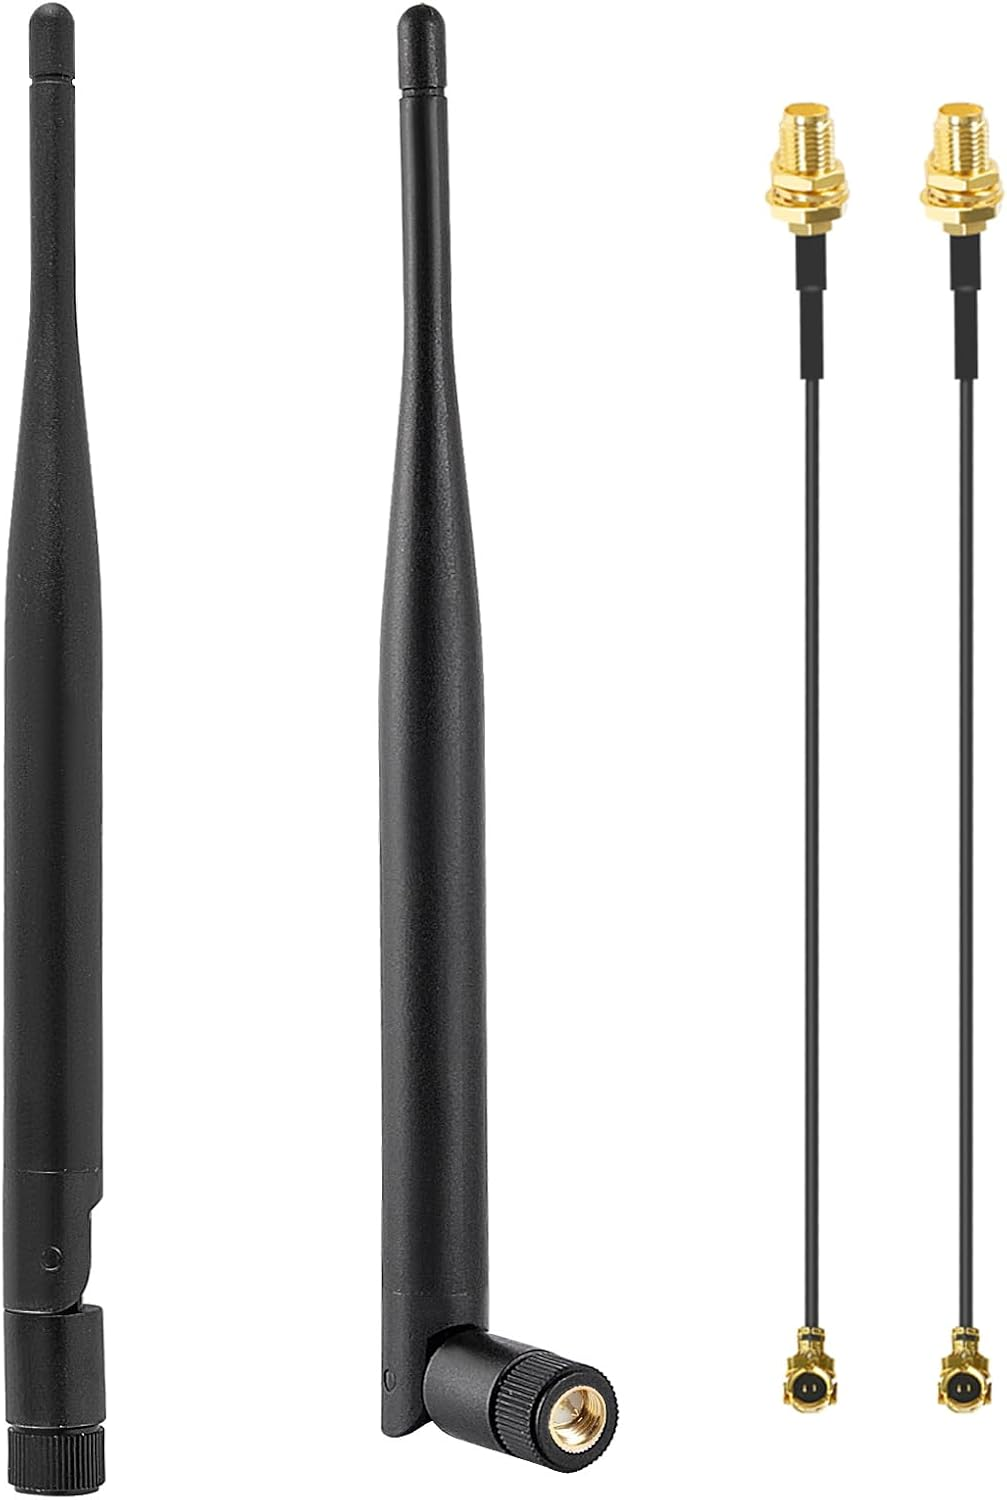
For the test we used an ESP32-S3, a Wi-Fi HaLow dongle configured as an access point and one antenna from a pack of two. The hardware used cost US$124.76, excluding shipping and courier handling to Uruguay.
How we ran the test
We used a Wi-Fi HaLow access point connected to a computer and an ESP32-S3 with HaLow as the mobile node. The access point stayed fixed during each run. The node was powered by a powerbank and carried to each point with the antenna vertical. At every stop we ran the same sequence to register download, upload, latency, RSSI and the longest pause between successful responses.
We completed four runs. The first two were inside an apple orchard, between crop rows, tree lines and changes in elevation. The other two were on roads. Those open runs had a different purpose: reducing vegetation and obstacles to observe how far the link could hold when the path was cleaner. In the first road run, high-voltage power lines crossed the path at the farthest point. The second was done on another segment without cables crossing the direct line between devices.
We were not trying to compare four identical environments. We wanted to observe the link in situations that could appear in a real installation. For that reason, each record preserves its distance and a short note about the surroundings. That note is part of the result: two points at a similar distance do not necessarily have the same radio path.
Results
The maps locate the points compared in the table. The lines only show the relation between each reference point and each stop. They do not represent the exact route or an estimated coverage area.
| Test | Distance | Note | Download / upload (Mbps) | Mean / p95 latency (ms) | Average RSSI (range) (dBm) | Max pause (s) |
|---|---|---|---|---|---|---|
| 1 / Field run / 0 | Reference point | - | - | - | - | - |
| 1 / Field run / 1 | 137.6 m | Dense tree line. Two downloads recorded; upload and RSSI not associated with certainty. | 0.614-1.196 / - | 51.36 / 51.7 | - | - |
| 1 / Field run / 2 | 276.0 m | Route between tree rows. | 1.504 / 0.783 | 60.90 / 68.3 | -69.11 (-78 to -61) | 0.883 |
| 1 / Field run / 3 | 301.1 m | Longest distance in this run. | 1.863 / 1.164 | 51.69 / 55.8 | -82.67 (-93 to -77) | 0.709 |
| 2 / Field run / 0 | Reference point | - | - | - | - | - |
| 2 / Field run / 1 | 353.1 m | Vegetation between both devices. | 0.440 / 0.119 | 58.08 / 83.4 | -88.33 (-91 to -83) | 0.924 |
| 2 / Field run / 2 | 534.4 m | Tree line and orchard in the path. | 1.088 / 0.397 | 48.26 / 59.0 | -90.22 (-93 to -86) | 2.408 |
| 2 / Field run / 3 | 531.8 m | Link interrupted. Full download and upload returned 0. One retry reached 0.013 Mbps before being cancelled. | 0 / 0 | 735.27 / 1739.2 | -93.88 (-97 to -90) | 1.952 |
| 2 / Field run / 4 | 640.1 m | Different path from the previous point. | 0.218 / 0.053 | 143.23 / 427.6 | -93.44 (-96 to -89) | 2.848 |
| 3 / Road run / 0 | Reference point | - | - | - | - | - |
| 3 / Road run / 1 | 234 m | Open segment. | 2.295 / 2.146 | 50.26 / 67.6 | -76.65 (-87 to -70) | 0.890 |
| 3 / Road run / 2 | 506 m | Open segment. | 1.710 / 1.634 | 50.12 / 57.1 | -81.11 (-83 to -77) | 0.697 |
| 3 / Road run / 3 | 651 m | High-voltage cables crossed the road. Possible source of interference. | 0.023 / 0.004 | 109.58 / 260.1 | -84.56 (-93 to -79) | 11.042 |
| 4 / Road run / 0 | Reference point | - | - | - | - | - |
| 4 / Road run / 1 | 565 m | Segment without cables crossing the direct path. | 0.436 / 0.129 | 75.28 / 90.9 | -91.83 (-100 to -86) | 13.820 |
| 4 / Road run / 2 | 635 m | Segment without cables crossing the direct path. | 0.113 / 0.171 | 165.41 / 619.6 | -97.00 (-103 to -92) | 0.759 |
| 4 / Road run / 3 | 753 m | Segment without cables crossing the direct path. | 0 / 0.102 | 1312.94 / 2211.0 | -100.29 (-103 to -97) | 3.559 |
Table 2. Consolidated records from the four runs. Points 0 only locate the reference and do not contain a measurement.
Before starting the second field run, we measured both devices together. We registered 2.46 Mbps download, 2.63 Mbps upload and an average RSSI of -42.67 dBm. This was a single reference to confirm the setup before moving the node, and it was not included as a distance point in the table.
In the first field run, RSSI dropped from -69.11 dBm at point 2 to -82.67 dBm at point 3. However, the measured throughput at point 3 was higher. We kept the result because it belongs to a complete run and we found no evidence of a measurement error. It shows a limit of the trial: each point had few repetitions and instant performance varied more than signal strength.
The second field run showed another difference. At 531.8 meters the link was interrupted. At 640.1 meters it transferred again, although slowly. The closer point was behind a dense tree line and in a lower area. The farther one had another path. We cannot attribute the change to one cause, but distance alone did not order the results.
Conclusions
Wi-Fi HaLow maintained a usable link in many of the measurements. In the first road run it reached 506 meters with more than 1.6 Mbps in both download and upload. There was also transfer at longer distances, but with lower speed, higher latency and longer pauses. The result is enough to continue evaluating the technology. It is not enough to define a coverage distance.
The test also partially supported a hypothesis we had taken from documentation and previous experiences: HaLow could behave better through vegetation and obstacles than conventional Wi-Fi. We do not consider that generally confirmed, because the trial was limited, but we did see link and transfer in conditions where the path was not clean. For our case, that evidence is enough to keep HaLow inside the design and measure it with stronger methodological control.
Distance alone did not explain the link behavior. In the field, one point at 531.8 meters had no transfer, while another at 640.1 meters did transmit. On the road, the 651-meter point coincided with a marked drop and with high-voltage lines crossing the path. These are observations, not demonstrated causes. Future tests should repeat each point and separately record height, orientation, terrain, vegetation and possible interference sources.
LoRa and Wi-Fi HaLow serve different tasks inside the same node. The final architecture may need both.
LoRa and Wi-Fi HaLow do not solve the same task. LoRa remains appropriate for short, low-power messages. HaLow allows us to consider images and heavier files inside the property. Our connectivity node may need both technologies and choose one or the other according to the data being transported.
The test used one setup, four runs and a small number of points per run. Some runs were incomplete and the table keeps them as such. We also did not repeat each location enough times to calculate a stable relation between distance and performance. That is why the publication separates measured values from observations about vegetation, terrain and cables. Those observations guide the next test, but they do not fully explain the results by themselves.
Sources for this section: TOML exports from the measurements on August 2 and August 16, 2026, georeferenced route points and field notes. Technical context: IEEE 802.11ah.